
Through the collaboration with the International Mathematical Modelling Challenge (IM2C) Committee (Zhonghua) and participating schools, we shared one of the topics for the 2020 Greater China contest and a corresponding winning paper in the July issue of our e-Newsletter. This time we continue to share another topic of the contest – Credibility Assessment of Online News.
“A lie can travel halfway around the world while the truth is putting on its shoes.” This adage has never been truer than in the era of online media. Misinformation can quickly reach thousands or even millions of readers, thus, the concern over the credibility of online news is growing worldwide. Assessment of credibility of online news has been a pressing challenge for the health of the information ecosystem where every citizen in the digital age is being affected. The 2020 IM2C sets such challenge for secondary school students from Greater China.
The article below is an abbreviated version from the winning paper by Beijing National Day School in China which has won Outstanding Award in IM2C 2020 of Greater China.
If you are secondary school student or you are teaching in a secondary school, and interested in participating in the challenge, please stay tuned here for the latest information.
Students: Qi Qi, Hu Qi Jun, Liu Yu Meng, Song Yi Dong
Abstract
With the advent of the internet age, the credibility of online news is particularly important. Based on the number of logical fallacies, the number of citations, the number of non-objective pronouns & punctuations, and the number of grammatical mistakes, this paper adopts a classification method and uses 109 news data as the training set and 40 news data as the test set to establish a static model and a dynamic model. The final average residual of the static model is 0.7625, and the average residual of the dynamic model is 0.7875.
Basic Assumptions
- Every indicator used to assess news credibility is independent.
- Language used in the article does not influence the credibility of online news.
Nomenclature
Table 1: Nomenclature
| Quantity | Symbol | Unit |
| The number of grammatical mistakes per word count | x | / |
| The number of logical fallacies per word count | y | / |
| The number of non-objective pronouns & punctuations per word count | z | / |
| The number of citations per word count | w | / |
| The function for the grammatical mistake indicator | Gr | / |
| The function for the logical fallacy indicator | Lo | / |
| The function for the non-objective pronoun & punctuation indicator | Pp | / |
| The function for the citation indicator | Ci | / |
| The weighting for the function of the grammatical mistake indicator | A | / |
| The weighting for the function for the logical fallacy indicator | B | / |
| The weighting for the function for the non-objective pronoun & punctuation indicator | C | / |
| The weighting for the citation indicator | D | / |
| The position vector for every point representing a piece of news in the model’s coordinate systemThe position vector for every point representing a piece of news in the model’s coordinate system | V | / |
| Fitting set (The set used to fit the functions for indicators) | F | / |
| Assessing set (The set used to assess news credibility) | M | / |
| Weighting set (The set used to adjust the weighting for the functions for indicators) | W | / |
| The expert score of news credibility | SE | / |
| The distance between an assessed point and a known point in the coordinate system | d | / |
| The assessed score of news credibility | S | / |
| Residual (The difference between the assessed score and the expert score) | r | / |
| Average Residual | r | / |
Model Construction
A. The Framework and Measurement of Indicators
1 The Framework of Indicators
First, the paper defines the dimensions of news credibility according to the theory of news credibility(1) and determines the indicators reflecting these dimensions. The five dimensions are scholarly nature, accuracy, objectivity, authority, and immediacy. However, since the news that the paper covers, unlike the news concerned in the reference, was recent, and expert scores were all given within two weeks from publication, immediacy is eliminated from the dimensions.
Under the four remaining dimensions, the paper proposes 13 potential indicators. By drawing scatter plots of expert score vs every indicator and performing analysis for correlation, the paper determines four indicators that are correlated with expert score – the number of grammatical mistakes per word count, the number of logical fallacies per word count, the number of non-objective pronoun and punctuations per word count, and the number of citations per word count, assessing the scholarly nature, accuracy, objectivity, and authority of news, respectively.
2. The Measurement of Indicators
Since the targets of assessment are the given 40 pieces of news, the paper needs another 109 pieces of news on climatefeedback.com and healthfeedback.com(2, 3) that are not provided by the test question to establish the model. To measure the four indicators of the 149 pieces of news (the News Articles) in the framework, the paper uses the methods below.
- Putting the text of the aforementioned News Articles into Grammarly(4) to measure the total numbers of words and grammatical mistakes(5); calculating the number of grammatical mistakes per word count (x).
- Setting a list of words that signal logical fallacy; measuring the number of these words in the News Articles; dividing this number by the total number of words to estimate the number of logical fallacies per word count (y).
- Measuring the total number of non-objective pronouns and punctuations in the News Articles; dividing this number by the total number of words to obtain the number of non-objective pronouns & punctuations per word count (z).
- a list of words that signal citations; measuring the number of these words in the News Articles; dividing this number by the total number of words to estimate the number of citations per word count (w).
B. Static Model
1 Fitting Functions
After measuring the indicators of the News Articles, the paper determines the relationship between news credibility and each of the four indicators. The method is to draw scatter plots (shown in fig.1~4) of news credibility vs an indicator while controlling the other three indicators in small intervals. The paper uses Logger Pro to find fitting curves with the smallest RMSEs, getting the results below.
a. The function for the grammatical mistake indicator:
Gr(x) = -1.0019 × ln(23.910x)
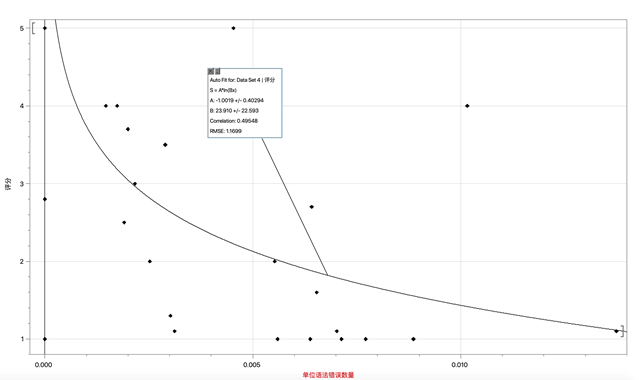
Fig. 1: The Fitting of Gr
b. The function for the logical fallacy indicator:
Lo(y) = -202.81y + 4.3979
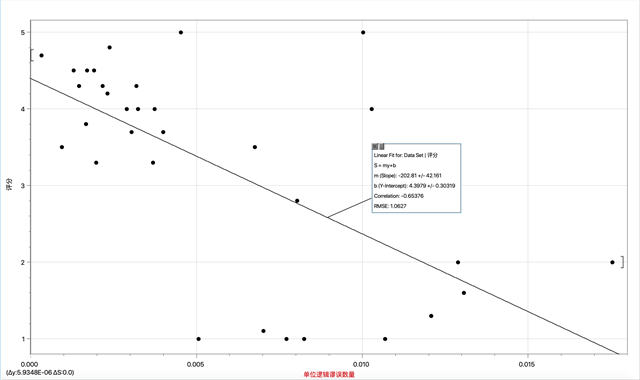
Fig. 2: The Fitting of Lo
c. The function for the non-objective pronoun & punctuation indicator:
Pp(z) = -0.34024 × ln(0.091420z)
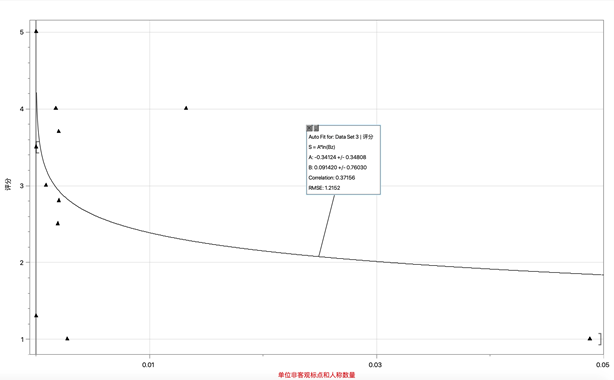
Fig. 3: The Fitting of Pp
d. The function for the citation indicator
Ci(w) = 166.29w + 1.9086
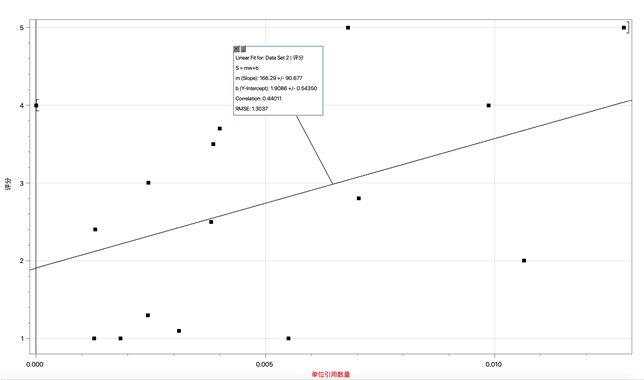
Fig. 4: The fitting of Ci
2. Construction of a 4-D Coordinate System and Adjustment of Weights to Obtain Credibility
After determining the respective relationships between the indicators and
news credibility, the paper sets the origin to be (0,0,0,0), with axes x, y,
z, w, representing the four indicators, and constructs a four-dimensional
coordinate system. The paper selects the 109 pieces of news out of a total
of 149 and then maps the indicators to
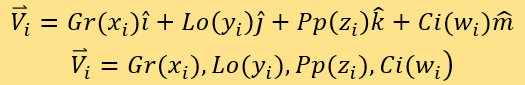
Gr(xi),Lo(yi),Pp(zi),Ci(wi), ,
in a range of [1,5]. This transforms every news to a point in the coordinate
system. The paper sets the unit vectors of the four dimensions to be
 uses
index i to label the corresponding point of each news piece in the system,
and expresses each point by coordinate vector and position vectors:
uses
index i to label the corresponding point of each news piece in the system,
and expresses each point by coordinate vector and position vectors:
The paper compares the distances of tested points and known points to determine expert scores. The four coordinates are A*Gr(x)、B*Lo(y)、C*Pp(z), and D*Ci(w) repectively. Define SEi to be the expert score of the i^th point to be tested, and assessing set M to be the fitting set F. Put the corresponding points of news where expert scores are known in set M in the coordinate system. Use index j to label points in set M, each of whose position vector is:

It is worth noting that the weights A, B, C, D have not been determined yet. The paper defines SEj to be the expert score of jth point in set M. For each point denoted i and all point denoted by j, calculate the distance by:
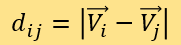
Extract the smallest n Dij, and further denote these points by j*. Use the following formula to calculate Si- the credibility score of tested news:
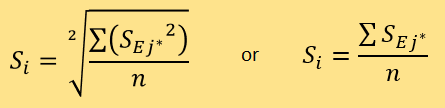
The paper will compare the square average and the arithmetic average in Sensitivity Analysis. Then use the following formula to calculate ri (the difference between the assessed score and expert score of the news denoted by i) and the average residual r. There is no need to differentiate it, so:
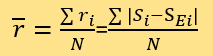
N is the total number of tested data. Define weighting set W to include all
news with known scores that are not in set F, and work the 40 given news
articles through the procedures as above as the news to be tested. By
python, the most optimal set of weights (A, B, C, D) which minimises  can
be found. Lastly, the paper uses the program to calculate Si of
the news to be tested and .
can
be found. Lastly, the paper uses the program to calculate Si of
the news to be tested and .
C. Dynamic Model
Based on the static model, the paper adds a learning system to build a dynamic model. More specifically, after the most optimal set of weights is determined, when each Si is calculated, put the corresponding point in to the assessing set M, and then estimate the credibility of the next news article.
Model Solution
A. Static Model
The arithmetic average is used to calculate Si. According to the calculation
of the python program, the optimal weight set is {A=0.4, B=0.9, C=0.01,
D=0.6}. The residuals of the prediction results include 15 residuals equal
0.0, 2 residuals equal 0.5, 16 residuals equal 1.0, 1 residual equals 1.5
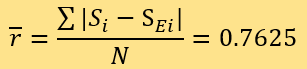
and 6 residuals equal 2.0. Calculate to get:
Then the square average is used to calculate Si, and the optimal weight set
is {A=2.7, B=3.3, C=0.01, D=0.01}. The residuals of the prediction results
include 15 residuals equal 0.0, 2 residuals equal 0.5, 16 residuals equal
1.0, 1 residual equals 1.5 and 6 residuals equal 2.0. Calculate to get:
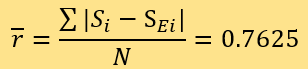
Therefore, the average residual of a predicted score of news article credibility and expert score measured by the two methods are both 0.7625.
B. Dynamic Model
Through program calculation, the optimal weight set of the model is {A=1.5,
B=0.6, C=4.8, D=2.4}. The residuals of the prediction results include 16
residuals equal 0.0, 3 residuals equal 0.5, 13 residuals equal 1.0, 7
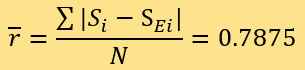
residuals equal 2.0, and 1 residual equals 3.0. The can be calculated as:
Model Analysis
A. Result Analysis
Before setting up the model, this article uses the random forest algorithm provided by Mathematica to evaluate the predicted scores of news credibility for 40 news articles, and the average residual is 1.45. Comparing to the average residual error of 0.7625 of the static model and the average residual error of 0.7875 of the dynamic model, we know that the static and dynamic models in this article can have the average residual being only about half of the random forest method. In these two models, the prediction of the static model is more accurate.
B. Advantages and Disadvantages
The first advantage is that the models’ results are very accurate. The average error of the static and dynamic models when calculating the score with the square average is controlled within 0.8, which is less than the unit score of 1.
Second, it has a weighting mechanism that can adjust the importance of different indicators according to the needs of different scenarios.
The disadvantage of the static model is that it requires a larger training set, otherwise it could not be that accurate. It can be seen from the above advantages and disadvantages that the dynamic model is more suitable when there is a large amount of news with known credibility at the beginning, and there is a large demand for testing in the later stage, so a large number of news with unknown credibility is needed for the learning process.
C. Model Improvement – Tribe-Seeking Judgment Method
The judging method of the model is to arrange the data points of news articles with known credibility within the coordinate system in increasing order of the distance from these data points to the points of tested news, to calculate and round off the average credibility of the news represented by the first certain data points and obtain the assessing result. However, by actual assessment we found that news articles of the five scores actually form more than five “tribes”, meaning that news articles of the same score in the coordinate space form multiple separated regions. To give an example of the problem this may bring, if data points of news articles with known credibility 3 form two “tribes” far away from each other, when a tested news is in one of the two “tribes”, its score ought to be calculated as 3.
However, because it is rather far away from news articles in the other score-3 “tribe”, and score-5 news articles, by chance, form another “tribe” nearby, the score of tested news might be calculated as 5. To tackle this problem, we can make an improvement by applying k-means clustering before training the static model. We anticipated that the training result would be better. However, after realising the improvement plan, we found the result has not necessarily improved. Set the k value of k-means as 3, we obtain an average error of 0.87, conversely increased by 14%. We believe the reason for this is the lack of news articles with known score, and that articles are unevenly distributed throughout the scores. This gives rise to unsatisfactory results of k-means clustering.
Sensitivity Analysis
When controlling other parameters, we use the rate of change of before
and after the parameter changes to test the sensitivity, with the formula
The first parameter is n, meaning that after a tested point enters the
coordinate system, the model chooses the n points closest to the tested
point to determine the point’s score. We found that when n changes by 28%,
changes by 16%. When n is approximately 20% of the size of the total
assessing set, the optimal can be found.
The second parameter is the step length of searching for the optimal weights. We found that adjusting the step length has rather little influence on searching for the optimal weights, thus the step length can be increased to an adequate extent to promote time efficiency.
Conclusion
This paper fully considers the five dimensions assessing online news credibility and determines the framework of indicators. The framework contains four indicators related to credibility that exactly covers the four dimensions besides immediacy, which does not apply to the news we are assessing.
This paper utilises the proper and tested approach to measure the indicators in the framework and employs two versions, static and dynamic, of our original model to assess the credibility of 40 given news articles respectively. Though limited by the small sample size, our static and dynamic models control the residual between the assessed value and the expert score to 0.7625 and 0.7875. Between the models, the results given by the static model are especially accurate and precise, and the dynamic model has great potential with larger data volume. This paper utilises tribe-seeking judgment method in an attempt to improve the model but finds that the results have not improved.
The significance of our models lies in the development of a set of indicators, needless of manual measurement, that is capable of assessing news credibility with inherent extreme complication. This provides an opportunity for publishers, social media and the public to know whether a news article is credible or not conveniently and accurately. In view of this, we cannot only help news audience accept information with higher authenticity and effectiveness but also guide the discussion about the intrinsic influencing factors of news credibility in society, which further creates huge social benefits. If we can expand the research object to other types of news besides scientific ones, the application scope of the models can be further widened.
Reference:
- Cassidy, William P. “Online News Credibility: An Examination of the Perceptions of Newspaper Journalists.” Journal of Computer-Mediated Communication, vol. 12, no. 2, 2007, pp. 478–498. ResearchGate, doi:10.1111/j.1083-6101.2007.00334.x.
- “Scientific Feedbacks.” Climate Feedback, https://climatefeedback.org/feedbacks/.
- “Scientific Feedbacks.” Health Feedback, https://healthfeedback.org/feedbacks/.
- “Write Your Best with Grammarly.” Grammarly, http://www.grammarly.com/.
- Collins, Bryan. “Grammarly Review: Is This Grammar Checker Worth It?” Become a Writer Today, 1 Nov. 2019, https://becomeawritertoday.com/grammar-checker-review-grammarly/#How_Effective_is_Grammarly_for_Proofreading_English
September 2020