Plastic Wastes in Hong Kong and the World
Like many other people living under the pandemic, Eric used to buy bottled beverages and take away with polystyrene containers and cutleries. What Eric and other people do not know is that we are creating lots of plastic wastes. According to the report of "Monitoring of Solid Waste in Hong Kong – Waste Statistics for 2020" published by the Hong Kong Environmental Protection Department, around 2,312 tonnes of plastic wastes were produced every day in Hong Kong (ranked 3rd and about 21% of the total municipal solid waste).
The earliest synthetic plastics such as polyvinyl chloride, polyethylene and polystyrene were marketed in 1930s as there was a shortage of natural rubber. Due to its relatively low cost and unique properties, the world production of plastics increased exponentially from 2 million tonnes in the 1950s to 270 million tonnes in 2010 and 350 million tonnes in 2017. Today we have become addicted to plastic products, especially those single-use plastics, including bags, food packaging, bottles, straws and stirrers, without thinking where these plastics would end up. Over 42% of plastics produced were utilised for packaging and would be disposed upon use. Only 9% of the plastic waste produced worldwide would be recycled, where the remaining would be treated as municipal solid waste. Approximately 60% of used plastic materials (equivalent to 275 million tonnes in 2010) were disposed of as waste and the amount exceeded the annual production rate.
Apart from landfill and incineration, plastic wastes were dumped to the surrounding habitat. A report from the World Economic Forum in 2016 estimated that each year, at least 8 million tonnes of plastic waste generated in coastal regions ends up in the oceans. Another survey by Eriksen et al. in 2014 by the use of surface net tows and a visual survey, which was estimated that a minimum of 5.25 trillion pieces of plastic fragments are floating on the ocean surface worldwide.
What Are Microplastics and Where Do They Come From
Among these plastic contaminants, plastic materials with sizes less than 5 mm were found to be significantly more abundant than larger pieces. In 2004, Richard Thompson, a marine ecologist at the University of Plymouth, started to describe plastic materials in marine sediments and water samples at such size as "microplastics". In contrast to larger plastic materials, microplastics pose severe environmental impacts because they can be ingested and bioaccumulated. Regarding to the lower size limit for microplastics, different studies proposed different measurements ranging from nanometer scales up to 20 μm. It was not until a publication by Gigault et al. in 2018, where another terminology of "nanoplastics", which is defined as "particles resulting from degradation of plastic objects" and "within size ranging from 1 nm to 1 μm" was proposed before a consensus to the lower size limit of microplastics was set at 1 μm.
For the sources, microplastics may be directly released into the environment (i.e. primary microplastics). They can be added intentionally as ingredient, for example, microbeads as scrubbing agents in cosmetics and personal care products, which will be rinsed off and discharge to the environment through the sewage system. Although Canada, Ireland, the Netherlands and the United Kingdom introduced legislation to ban the use of microbeads in cosmetics, substantial use of microbeads can still be found in the rest of the world. Besides, primary microplastic can be resulted from normal use during the product life cycle. Washing of synthetic textiles and abrasion types would release microplastics in fibre and fragment types respectively. An estimation was made by researchers that there could be more than 700,000 fibre type microplastics released to the sewage during each normal cycle of machine washing. Compared with the total microplastics released to the environment, around 15-31% were contributed by primary type. The remaining 69-85% were released through degradation from large plastic wastes in the environment by means of mechanical, chemical or microbiological actions. Through different routes of emission, microplastics were found not only in habitat like marine waters, rivers, lakes, sediments, Arctic snow, Antarctic ice and high-altitude Himalayas, but also in wildlife and foods including shellfish, birds, table salt, drinking water and beer. A survey by Albert Koelmans at Wageningen University predicted children and adults could ingest more than 100,000 microplastic every day, equivalent to the mass of a credit card in a year.
Microplastics Found in Human and Animals
Regarding the abundance and size distributions of microplastics, a study collected near-surface water samples from the Atlantic Ocean, where the volume of microplastics increased steadily when the size decreased, and over 64% of the microplastics found were less than 40 μm in diameter. Microplastics with smaller sizes may pose a higher toxicity to the environment, as decreasing the size of particles will likely increase their power of penetrating biological barriers. Jeong et al. investigated the toxicity of nonfunctionalised polystyrene microbeads in 2016 by varying the particle size up to 6 μm, where microplastics at such size can be taken up by microorganisms such as monogonont rotifers (≈ 200 μm). The results showed that the smaller the particle size was, the higher the microplastic toxicity. A negative correlation with particle size was observed in monogonont rotifers, with effects such as reduced growth rate, decreased lifespan and longer reproduction time. For fish, Lu et al. conducted an in vivo laboratory study in 2016 for zebrafish (Danio rerio) to investigate the uptake and tissue accumulation of small microplastics (i.e., polystyrene), and they showed that microplastics with a diameter of 5 μm not only accumulate in the gastrointestinal tract but also in the gills and liver. The inflammatory response and lipid accumulation have also been observed in fish livers during histopathological analysis. Haave et al. analysed wildlife samples in 2021, including otters, ducks, guillemots, cods and flounders, and found microplastics (≥ 10 μm) not only in the gastrointestinal tract via ingestion and showed that they also migrated to the liver and muscle. Hence, it is possible that small microplastics can enter the bloodstream from gastrointestinal tract. Some other studies investigated the gastrointestinal tract of shrimp in the Arabian Sea and Northern Bay of Bengal, and they identified an average of 7.80 and 6.78 items of microplastics in the gastrointestinal tract, respectively. However, because the microplastics of these two studies were identified by microscopy, the amount of small microplastics down to 1 μm could not be identified. When marine aquatic organisms ingested microplastics in the environment, some physiological effects such as decreased appetite and metabolic rates and even increased mortality rates were reported. Some studies also found that larvae and juveniles maintained in marine fish culture are more susceptible to microplastic contamination.
In addition to microorganisms and the environment, microplastics at micron / sub-micron levels may also affect human cells. Another study by Wu et al. in 2019 studied the adverse effects of microplastics on human colon adenocarcinoma cells, where the activity of a plasma membrane ATP-binding cassette transporter was inhibited by polystyrene microplastics at 5 μm and led to an increase in arsenic toxicity. From the perspectives of abundance and toxicity, it is necessary to focus environmental studies on small microplastics with sizes below 50 μm. Recently in 2022, a study in the Netherland was found quantifiable amount of microplastics in 17 human whole blood samples out of 22 healthy volunteers, which suggests microplastics can transport to different organs via the bloodstream.
A report of microplastics in fisheries and aquaculture was published by the Food and Agriculture Organization of the United Nations in 2017 and mentioned that "microplastic contamination of aquatic environments will continue to increase in the foreseeable future and at present there are significant knowledge gaps on the occurrence in aquatic environments and organisms of the smaller sized microplastics (less than 150 μm), and their possible effects on seafood safety". Thus, future microplastic abundance studies and exposure risk assessments of wildlife should focus on smaller microplastics, especially those smaller than 50 μm or even 10 μm in size. Larger microplastics are believed to be disposed of more easily by egestion.
Limitations of Traditional Methods in Collecting and Quantifying Microplastics in Environmental Waters
However, most of the environmental water studies were focused on microplastics with sizes above 50 μm, as the sampling was conducted mainly by the use of nets and sieves, such as manta nets (≥ 333 μm), plankton nets (≥ 100 μm) and metal sieves (125-355 μm). For example, a technical memorandum issued by the US National Oceanic and Atmospheric Administration (NOAA) in 2015 recommended the use of a 335 μm surface net for filtration of microplastic materials. A study conducted by Lindeque et al. in 2020 tried to collect microplastics via surface trawls by using nets with mesh sizes of 100, 333 and 500 μm in parallel, in which microplastics collected by the 100 μm net presented 2.5-fold and 10-fold increases in number compared with the 333 μm and 500 μm nets, respectively. Moreover, small microplastic materials with diameters between 1 and 50 μm may not be visible to the naked eye, which makes identification and quantitation difficult. To date, not many survey studies of water samples have been conducted to cover microplastics with sizes less than 50 μm or lower, as there is no effective method for collecting and quantifying this fraction of microplastics. The research team thus developed a new approach to effectively collect, detect and quantify small microplastics from 1 to 50 μm in environmental water samples.
Development of Novel Method to Quantifying Small Microplastics
One of the difficulties is to distinguish microplastics, especially those clear in colours, from other organic and inorganic particles. The use of fluorescent dyes can provide the solution for the detection of plastic particles. In 2017, a study from Maes et al. demonstrated the use of Nile red (NR, chemical name: 9-diethylamino-5H-benzo[a]phenoxazine-5-one) fluorescence staining to tag microplastics, where stained microplastics could be identified under microscope with the illumination of a blue LED light source. This method requires only a short incubation period for staining microplastics and provides a very high recovery rate (96.6%). As shown in Figure 1, some commonly found microplastics, including polystyrene (PS), low-density polyethylene (LDPE), polypropylene (PP), poly (methyl methacrylate) (PMMA), polyvinyl chloride (PVC), polylactic acid (PLA) and acrylonitrile butadiene styrene (ABS) were stained by NR, which can be detected by illuminating under a blue excitation light source (wavelength ~ 450-480 nm) and viewed with an emission filter at 515 nm. Fluorescence varying from deep red to strong yellow gold would be observed on the stained surface of microplastics.
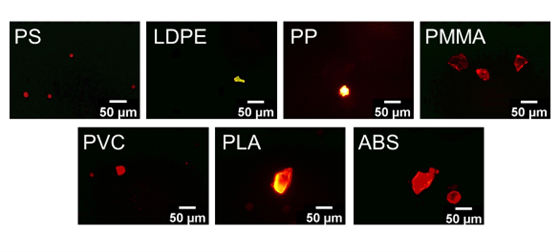
Figure 1. Microscopic images of some commonly found microplastics stained by Nile red.
NR is a lipophilic dye that can stain not only plastic materials but also other organic matters, where staining of other organic matters by NR would lead to interference and overestimation the pollution caused by microplastics. To alleviate the effect caused by organic materials in environmental water, a digestion process that oxidising organic matters using hydrogen peroxide (H2O2) was conducted before the NR staining. The use of hydrogen peroxide can help to reduce the organic carbon but would not cause degradation of microplastics.
In order to detect and quantify small microplastics, a novel technique, namely, flow cytometry, was proposed. Originally flow cytometry is an instrument using lasers to detect optical signals from cells and particles in a fluid. As shown in Figure 2 for the schematic diagram of flow cytometry, sample with suspension of cells / particles would be focused by sheath fluid hydrodynamically in the nozzle to let cells / particles pass through lasers at the flow cell one at a time. Forward, side and fluorescence light signals produced after irradiation by lasers can be detected, where the chemical and physical properties of cells / particles can be obtained. In 2020, a preliminary study by scientists from Ireland, Norway and Denmark demonstrated flow cytometry can detect certain small microplastics in ultrapure water. Although the study involved only adding sufficiently large amount of single type microplastics in ultrapure water, the approach of flow cytometry is very encouraging and may possibility be used in detecting small microplastics in environmental water samples more accurately. Advantages by the use of flow cytometry over microscopic identification manually are as follows:
- automatic quantification rather than manual counting, increase the accuracy (less false positive / negative) and speed (< 10 min per sample)
- very small microplastics with size as small as 1 μm (or even smaller) can be identified
- the avoidance of human subjectivity during since the entire process does not require the visual interpretation of particles (less labour intensive)
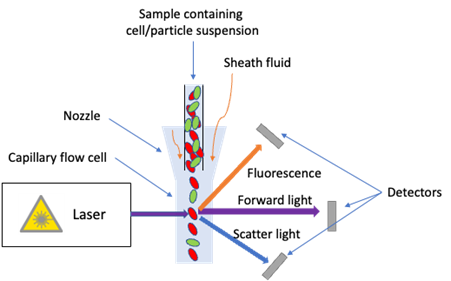
Figure 2. Schematic diagram of flow cytometry
The team from Hong Kong Metropolitan University and Stockholm University would like to extend the lower size limit of microplastic analysis down to 1 µm by flow cytometry for monitoring microplastics in environmental water samples. As sample volume for flow cytometry analysis is usually small (up to a few millilitres) and the concentration of small microplastics in environmental samples may be low, an effective method to concentrate small microplastics from a large volume of water samples is critical in order to enhance the sensitivity and maintain the representative of sample collected. Figure 3 showed the flow diagram of the method. Some precautions for the analysis of microplastics in environmental water samples:
- avoid using plasticware. Glassware and metalware should be used for the sampling and sample preparation.
- before use, all glassware shall be rinsed with ultrapure water and pyrolysed in a muffle furnace at 450°C for 5 hrs to remove all residual organics. To minimise airborne contamination, all glassware was covered with aluminium foil before use
- all reagents and solutions were filtered through a 0.22 µm syringe filter before use to minimise the risk of contamination
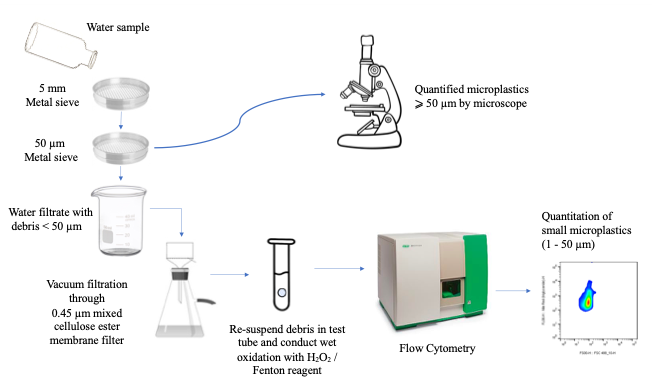
Figure 3. Flow diagram to preconcentrate, wet oxidise staining and analyse microplastics in water samples by flow cytometry.
In brief, the procedures of the method are described below. Five litre of environmental water sample was first passed through a 5 mm metal sieve to remove large debris, followed by separating microplastics (with other particles as well) in two size ranges by a 50 μm metal sieve. Those microplastics with size greater than or equal to 50 μm that retained on the sieve was analysed by traditional microscopic method. The filtrate containing microplastics with size less than 50 μm were pre-concentrated by vacuum filtration. Small microplastics retained on the filter membrane was re-dissolved into 10 mL ultrapure water (i.e. 500x concentration from originally 5 litres of sample). The pre-concentration process not only reduces the sample volume to increase the sensitivity and detection limit, but also suppress the effect of interferences from the sample matrix by removing soluble organic carbon and inorganic salts. Since density of different types of plastic are varied, a surfactant (Tween 20) was added during the re-dissolution to reduce the surface tension of water and facilitate suspension of microplastics. The organic content in the pre-concentrated solution then underwent wet oxidation by hydrogen peroxide. Upon completion of the wet oxidation, microplastics with size between 1 and 50 μm were stained by fluorescence NR dye and quantified by flow cytometry. Figure 4 shows the flow cytometry diagram of fluorescence signal (number of counts of stained microplastics) versus forward scatter plot (size of microplastics), for ultrapure water fortified with microplastics in three different sizes (1, 10 and 38 μm), where the size of microplastics can be determined accordingly.
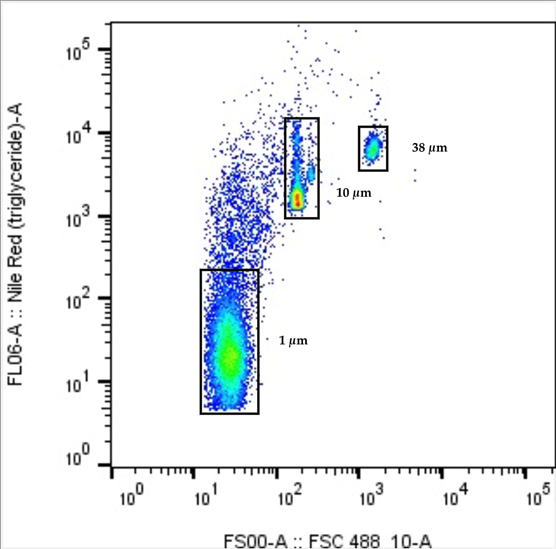
Figure 4. Flow cytometry diagram of fluorescence signal versus forward scatter plot, for water sample fortified with microplastics in three different sizes (1, 10 and 38 μm),
To validate the new method, we have compared the results of microplastics with size from 10-50 μm with visual identification using microscopy by fortifying known amount of microplastics to both ultrapure and environmental water samples, where counts were found very similar using statistically analysis. All in all, the new method that consists of pre-concentration of MPs by vacuum filtration to increase the sensitivity, hydrogen peroxide wet digestion to reduce interference, NR fluorescent staining to increase specificity and flow cytometric determination to increase productivity and consistency, which is capable to quantify microplastics with size from 1-50 μm from environmental fresh water and seawater samples.
Determination of Microplastics in Marine Water
Two marine water samples were obtained at Ma Liu Shui Ferry Pier and Tsuen Wan West, Hong Kong, in July 2021 and April 2022, respectively, which were collected at a depth of approximately 1 m. The concentrations of microplastics at different sizes (i.e. 1-10 μm, 10-50 μm and > 50 μm) were summarised in Table 1.
| Sizes of Microplastics | Ma Liu Shui Ferry Pier (Particles per Litre) |
Tsuen Wan West (Particles per Litre) |
|---|---|---|
| ≥ 50 μm | 28 ± 6 | 35 ± 9 |
| 10-50 μm | 1,800 ± 208 | 29,336 ± 2,134 |
| 1-10 μm | 112,813 ± 10,209 | 336,024 ± 55,603 |
Table 1
From the results, most of the microplastics found were below 10 μm, where the abundance of microplastics with sizes at 1-10 μm was found more than 4,029 and 9,600 times than those with sizes at ≥ 50 μm at Ma Liu Shui and Tsuen Wan West respectively. The results reflect that microplastic abundance in the coastal waters of Hong Kong was quite high (in general > 100,000 particles L-1). Many previous assessments of microplastic in environmental water in Hong Kong and worldwide might be underestimated as they only examined microplastic with sizes ≥ 100 μm.
Since the microplastic quantity and distribution may vary from time to time and from location to location, a snapshot of microplastic pollution level at a particular spot at one time may not be representative enough to reflect the overall situation of microplastic pollution. A comprehensive study at multiple locations for two years might be needed before an affirmative conclusion about the spatial and temporal trends of microplastic abundance in Hong Kong.
Way Forward and Challenges in Microplastics Monitoring and Pollution
From the method we have developed, we have successfully extended the lower size limit to 1 μm, which can cover the gap to the assessment of complete size spectrum of microplastics in environmental water samples. However, there are many outstanding questions that are yet to be answered in the complete understanding of microplastic pollution. Our team are currently working on the solutions of these questions, including
- monitoring of spatial and temporal trends of microplastic pollution in Hong Kong marine waters;
- the use of more effective wet oxidation / digestion method to minimise the interferences from organic carbon;
- using other fluorescence dyes for plastic type identification, and
- extending the method for microplastic quantitation in other environmental waters (e.g wastewater) and matrices (e.g. sediment).
Since different laboratories may have their own method for sampling and microplastic assessment, results may be different and cannot be compared. Harmonized standard methods between different environmental scientists can also facilitate the comparison of results between studies and provide a global scientific platform for assessing microplastic pollution.
On the other hand, there is an urgent need to reduce the pollution of microplastics and emission of plastic wastes. However, no one-size-fits-all strategy is available as we are unable to stop using plastics immediately. Even if we can stop producing synthetic plastics now, existing plastic waste in the market, landfills and the environment would continue contribute to the environmental microplastic levels. Policies at national, regional and international levels are necessary to reduce the use of single-use food containers, cutleries, packaging and personal care products, and to increase the recycling yield of wastes. Sewage and rainwater treatment works may need to improve to minimise the release of microplastics to the environmental waters.
Authors:
Dr Eric Tung-Po Sze, Associate Professor, School of Science and Technology, Hong Kong Metropolitan University
Dr Sidney Man-Ngai Chan, Assistant Professor, School of Science and Technology, Hong Kong Metropolitan University
Dr Hoi-Shing Lo, Postdoctoral Fellow, Department of Environmental Science, Stockholm University, Sweden
Mr Yuet-Tung Tse, Postgraduate Student, School of Science and Technology, Hong Kong Metropolitan University
September 2022